Small Business Lending Statistics and Trends for 2026
Key Takeaways
- 36.2 million small businesses operate in the United States, employing 62.3 million people and generating 43.5% of GDP.
- Only 42% of financing applicants received the full amount they sought in the 2025 Federal Reserve Small Business Credit Survey, while 22% received none.
- Small banks had the highest full-approval rate at 57%. Online fintech lender application share grew from 17% in 2020 to 29% in 2025.
- The top reasons small businesses borrow are meeting operating expenses (56%) and pursuing expansion or new opportunities (46%).
- SBA lending hit a record $45.1 billion in FY2025, a 44.7% increase over FY2024.

Small business lending statistics for 2026 reflect a market defined by a persistent tension: business owners remain broadly optimistic about revenue growth, but cash flow pressure, rising input costs, and uneven access to capital continue to shape how and where they borrow. The data below is drawn from the Fora Financial Business Insights Report, the Federal Reserve's 2025 Small Business Credit Survey, SBA lending reports, and the SBA Office of Advocacy to give journalists, researchers, and business owners a consolidated view of the current lending landscape.
Key Small Business Lending Stats at a Glance
Small businesses are the dominant force in the U.S. economy by establishment count, employment, and job creation. That scale drives the demand for small business financing across the full spectrum of lender types and products.
- There are 36,207,130 small businesses in the United States. (SBA Office of Advocacy, February 2026)
- Small businesses employ 62.3 million people, representing 45.9% of all private sector workers. (SBA Office of Advocacy, February 2026)
- Small businesses account for 43.5% of U.S. GDP. (SBA Office of Advocacy, February 2026)
- Small businesses pay 38.7% of total private-sector payroll. (SBA Office of Advocacy, February 2026)
- From March 2023 to March 2024, small businesses created approximately 9 out of every 10 net new jobs. (SBA Office of Advocacy, 2025 Small Business Profiles)
- Between January 1995 and December 2024, small businesses created 20.7 million net new jobs, compared to 13.2 million from large businesses. (SBA Office of Advocacy / SBE Council, 2026)
- 76% of business owners expect revenue growth over the next 12 months. (Fora Financial Business Insights Report, 2026)
- 52% of business owners expect favorable economic conditions in 2026, up from 48% in 2025. (Fora Financial Business Insights Report, 2026)
- 86% of small employer firms use financing on a regular basis, with credit cards and loans being the most common products. (Federal Reserve Small Business Credit Survey, 2025 (released March 2026))
How Cash Flow Drives Small Business Borrowing
Most small businesses do not borrow because they are in financial distress. They borrow because of timing: revenue arrives after expenses are due. Seasonal demand, delayed receivables, payroll cycles, and inventory requirements all create gaps between cash in and cash out that financing is designed to bridge. Cash flow loans are often the fastest path to resolving these gaps when the window is narrow.
- Cash flow was the top financial challenge for small business owners in 2026, cited by 55% of Fora survey respondents. (Fora Financial Business Insights Report, 2026)
- Seasonal cash flow needs were a potential borrowing motivation for 41% of business owners surveyed by Fora. (Fora Financial Business Insights Report, 2026)
- 38% of business owners sought additional funding or loans to mitigate inflation, according to Fora's survey. (Fora Financial Business Insights Report, 2026)
- Rising costs of goods, services, and wages was the most common financial challenge reported in the prior 12 months in the Federal Reserve survey. (Federal Reserve Small Business Credit Survey, 2025 (released March 2026))
- More than four in ten small employer firms reported that increased costs associated with tariffs were a financial challenge in 2025. (Federal Reserve Small Business Credit Survey, 2025 (released March 2026))
- 77% of small employer firms reported rising operating costs, tariff-related cost challenges, or both in 2025. (Federal Reserve Small Business Credit Survey, 2025 (released March 2026))
- 59% of firms with outstanding debt used a personal guarantee to secure it, while 51% used business assets. (Federal Reserve Small Business Credit Survey, 2025 (released March 2026))
- 60% of small employer firms applied for financing in the 12 months leading up to the 2025 survey. (Federal Reserve Small Business Credit Survey, 2025 (released March 2026))
Small Business Loan Approval Rates by Lender
When evaluating approval rate statistics, the distinction between full approval, partial funding, and no funding matters significantly. A reported approval rate can mask a meaningful gap between what businesses sought and what they actually received. How personal credit affects business loan approval is one factor; lender type, loan size, and borrower financial profile are others.
- 42% of financing applicants received the full amount they sought. 36% received some or most, and 22% received none. (Federal Reserve Small Business Credit Survey, 2025 (released March 2026))
- Applicants at small banks were most likely to be fully approved, with a 57% full-approval rate, higher than any other lender type. (Federal Reserve Small Business Credit Survey, 2025 (released March 2026))
- 60% of borrowers who used online lenders reported that actual borrowing costs were higher than expected, compared to 37% at small banks and 32% at large banks. (Federal Reserve Small Business Credit Survey, 2025 (released March 2026))
- Credit union and bank applicants were more satisfied with their overall lending experiences than online lender and finance company applicants. (Federal Reserve Small Business Credit Survey, 2025 (released March 2026))
- High interest rates and unfavorable repayment terms were the most commonly reported challenges for businesses that used online lenders. (Federal Reserve Small Business Credit Survey, 2025 (released March 2026))
- The share of applicants fully approved has remained below prepandemic levels. In 2019, approximately 62% of applicants received full approval. (Federal Reserve SBCS / Crestmont Capital analysis, 2026)
- Among firms with steady month-over-month revenue growth of 10% or more, approval rates were 68%, well above the overall average. (Federal Reserve SBCS, 2025 survey data)
- The share of firms with no outstanding debt (31%) has grown moderately since 2020 (21%), returning to prepandemic levels. (Federal Reserve Small Business Credit Survey, 2025 (released March 2026))
Average Small Business Loan Amounts
Average loan amount statistics vary significantly by program, lender type, loan purpose, and borrower size. The SBA's program-level data provides the most reliable benchmarks for government-backed lending.
- SBA guaranteed approximately 84,840 combined 7(a) and 504 loans totaling $45.1 billion in FY2025, the highest guaranteed loan volume on record. (SBA 7(a) & 504 Activity Reports, FY2025)
- SBA 7(a) loans: 78,078 approved in FY2025, totaling $37.3 billion. (SBA 7(a) & 504 Activity Reports, FY2025)
- SBA 504 loans: approximately 6,762 approved in FY2025, totaling $7.8 billion. (SBA 7(a) & 504 Activity Reports, FY2025)
- The average SBA 7(a) loan size was $477,642 in FY2025, down from a pandemic-era peak of $704,630 in FY2021, reflecting broader program access to smaller borrowers. (SBA 7(a) & 504 Activity Reports, FY2025)
- FY2025 SBA guaranteed loan volume of $45.1 billion represents a 44.7% increase over FY2024's $31.1 billion. (SBA 7(a) & 504 Activity Reports, FY2025)
- Small-dollar 7(a) lending under $150,000 grew 228% from FY2021 to FY2025 (October through February), reflecting expanded SBA Express and Community Advantage programs. (SBA 7(a) & 504 Activity Reports, FY2025)
- Total SBA capital facilitation exceeded $100 billion in FY2025 when including disaster loans, investment programs, and other initiatives. (SBA, FY2025)
Why Small Businesses Borrow Money
The most common reasons small businesses seek financing reveal the operational realities of running a company: covering ongoing costs, investing in growth, and managing the financial pressure of expansion, inventory cycles, and timing gaps. Understanding borrower motivation helps lenders, policymakers, and business owners make better decisions about which financing products are appropriate for which situations. For businesses focused on growth, business expansion loans and inventory financing are among the most commonly cited specific use cases.
- 56% of financing applicants sought funding to meet operating expenses. (Federal Reserve Small Business Credit Survey, 2025 (released March 2026))
- 46% sought financing to pursue an expansion or new opportunity. (Federal Reserve Small Business Credit Survey, 2025 (released March 2026))
- 42% of Fora survey respondents cited refinancing existing debt as a borrowing motivation, up 6 percentage points year over year. (Fora Financial Business Insights Report, 2026)
- 41% cited seasonal cash flow needs as a potential borrowing motivation. (Fora Financial Business Insights Report, 2026)
- Inventory purchasing is among the top use cases for small business working capital borrowing, particularly in retail, manufacturing, and food service. (Federal Reserve SBCS / industry data)
- Payroll and staffing costs are a recurring financing need, particularly for businesses in service, construction, and healthcare industries where labor is the primary operating expense. (Federal Reserve Small Business Credit Survey, 2025 (released March 2026))
- Emergency expenses, equipment repairs, and unexpected operational costs frequently prompt unplanned financing applications, particularly for businesses without established credit lines. (Federal Reserve SBCS)
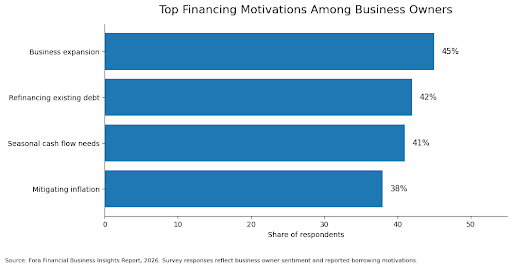
Source: Fora Financial Business Insights Report, 2026. Survey responses reflect business owner sentiment and reported borrowing motivations.
Small Business Lending Trends by Industry
Lending demand is not uniform across industries. Cash flow pressure, cost exposure, seasonality, and growth expectations vary significantly by sector. The following statistics use industry-level data from the Federal Reserve and Fora's survey to show where financing need is most acute.
Construction
- Construction businesses were the most optimistic in Fora's 2026 survey, with 63% expecting favorable economic conditions. (Fora Financial Business Insights Report, 2026)
- Construction is one of the most capital-intensive industries for small businesses, with payroll, materials, and equipment costs typically preceding project payment by weeks or months. (Industry analysis)
Construction businesses face project-based cash flow cycles that create recurring financing needs: materials and labor must be paid upfront while client invoices are settled on longer timelines. Construction business loans are specifically designed to bridge this timing gap.
Retail and Manufacturing
- Tariff-related cost challenges were most prevalent in retail (69%) and manufacturing (62%) in the 2025 Federal Reserve survey. (Federal Reserve Small Business Credit Survey, 2025 (released March 2026))
- 48% of small employer firms sourced at least some inputs from outside the United States in 2024. Of those, a large majority reported year-over-year price increases on those inputs. (Federal Reserve Small Business Credit Survey, 2025 (released March 2026))
Rising supplier costs, inventory carrying costs, and compressed margins in retail and manufacturing create direct pressure on working capital. When input prices increase faster than retail prices, businesses may need financing to maintain inventory levels and meet supplier payment terms.
Restaurants and Food Services
- Food service businesses consistently face among the narrowest operating margins of any small business sector, with food costs, labor, and rent collectively accounting for 60-80% of revenue in many cases. (National Restaurant Association / industry benchmarks)
- Seasonality, event-driven demand, and spoilage risk make inventory and payroll timing particularly difficult for restaurants, creating recurring working capital financing cycles. (Federal Reserve SBCS / industry analysis)
Restaurants and food service businesses are among the most frequent borrowers for short-term working capital. Payroll is due on fixed schedules regardless of weekly revenue, and food inventory cannot be deferred the way other business inputs can.
Service Businesses
- Service businesses, including healthcare, professional services, transportation, and home services, represent a significant share of small employer firms and consistently cite payroll and delayed client payments as top financial challenges. (Federal Reserve Small Business Credit Survey, 2025 (released March 2026))
- In service businesses, labor is typically the largest cost center. Payroll obligations precede invoice collection in most professional service and healthcare settings, creating a structural need for short-term working capital. (Federal Reserve SBCS / industry analysis)
Service businesses often operate on delayed payment cycles: work is completed before the invoice is paid, and the gap can range from Net 30 to Net 90 days in healthcare and professional services. Service business loans are frequently used to manage this timing gap and support staffing, equipment, and operational growth.
The Future of Small Business Lending
The small business lending market is changing in structure as well as volume. Online lender adoption is increasing, borrower expectations around speed and transparency are shifting, and data infrastructure is enabling faster underwriting decisions across the industry.
- The share of small business financing applicants that sought funding from online fintech lenders grew from 17% in the 2020 survey to 29% in the 2025 survey. (Federal Reserve Small Business Credit Survey, 2025 (released March 2026))
- 43% of small business applicants in 2025 used an online lender as their first choice, not a backup. (Federal Reserve SBCS / Nautix Capital analysis, 2026)
- Nearly half of small employer firms (46%) currently use AI in some capacity, and an additional 15% plan to begin using it in the next 12 months. (Federal Reserve Small Business Credit Survey, 2025 (released March 2026))
- Of AI-using small businesses, 71% reported increased productivity, 39% noted improved quality of goods and services, and 31% reported higher sales. (Federal Reserve Small Business Credit Survey, 2025 (released March 2026))
- 83% of AI-using small businesses apply AI to writing or marketing tasks, followed by individual productivity (61%) and planning or analysis (51%). (Federal Reserve Small Business Credit Survey, 2025 (released March 2026))
- The CFPB's small business lending data collection rule (Section 1071 of Dodd-Frank) requires covered financial institutions to collect and report small business lending data, intended to increase transparency in access to credit. (CFPB, 2026)
- Revenue and employment growth expectations for small businesses both declined to their lowest levels since the 2020 survey, with the revenue expectations index falling 6 points year over year. (Federal Reserve Small Business Credit Survey, 2025 (released March 2026))
What Fora's Business Insights Show
The Fora Financial Business Insights Report surveys small business owners annually to capture forward-looking sentiment, borrowing motivations, and operational challenges. This data reflects business owner perspectives and reported intentions, complementing the Federal Reserve and SBA data that measure actual lending outcomes.
- 52% of business owners expect favorable economic conditions in 2026, up from 48% in 2025. (Fora Financial Business Insights Report, 2026)
- 76% of business owners expect revenue growth over the next 12 months. (Fora Financial Business Insights Report, 2026)
- 55% of respondents cited cash flow as their top business challenge in 2026. (Fora Financial Business Insights Report, 2026)
- 41% cited seasonal cash flow needs as a potential borrowing motivation. (Fora Financial Business Insights Report, 2026)
- 42% cited refinancing existing debt as a reason for seeking additional financing, up 6 points year over year. (Fora Financial Business Insights Report, 2026)
- 38% of business owners sought additional funding or loans specifically to address inflation-related cost pressure. (Fora Financial Business Insights Report, 2026)
- 39% of respondents reported adopting AI tools in their business operations in 2026. (Fora Financial Business Insights Report, 2026)
- 73% of respondents reported that tariffs had impacted their business costs. (Fora Financial Business Insights Report, 2026)
- 68% of business owners reported using or considering an online lender for their most recent financing need. (Fora Financial Business Insights Report, 2026)
How We Chose These Lending Statistics
This article prioritizes recent, U.S.-specific small business lending data from credible primary and institutional sources. The core data sources are:
- Federal Reserve Small Business Credit Survey (SBCS): The 2025 SBCS, released March 2026, surveyed 6,525 small employer firms across all 50 states. It provides the most comprehensive demand-side view of small business financing access and outcomes available in the United States.
- SBA Office of Advocacy (2026): Provides official counts of U.S. small businesses, employment, GDP contribution, and payroll data. The February 2026 FAQ report is the most recent official release.
- SBA 7(a) and 504 Activity Reports (FY2025): Provides official loan volume, count, and program data for SBA-backed lending in fiscal year 2025.
- Fora Financial Business Insights Report (2026): Proprietary annual survey of U.S. small business owners. Reflects business owner sentiment and reported borrowing motivations; not a portfolio lending dataset.
Fora survey data reflects business owner perspectives and should be read alongside Federal Reserve and SBA data that measure actual lending market outcomes. Statistics should be reviewed and refreshed annually as new Federal Reserve, SBA, and survey data becomes available.
Get Faster Access to Working Capital
The lending statistics above reflect real pressure that established small businesses face: cash flow timing gaps, rising operating costs, seasonal demand, payroll obligations, and inventory cycles that do not wait on a bank's underwriting timeline. For businesses managing those pressures, the right financing product is one that can move when the business needs to move.
Fora Financial offers working capital, term loans, revenue advances, and a business line of credit with a five-minute application, three months of bank statements, no hard credit pull to check your options, and approvals in as little as four hours. Established businesses with at least 6 months in operation, $240,000 in annual revenue, and a 570 FICO score can check their options without any commitment.
Apply now and get a decision in as little as four hours.
Frequently Asked Questions
-
The most significant factors are credit score, time in business, annual revenue, cash flow consistency, existing debt load, and collateral availability. Lender type also plays a large role: small banks approve a higher share of applicants at full funding than large banks or online lenders, according to the Federal Reserve's 2025 Small Business Credit Survey. The purpose of the loan, the loan amount requested relative to revenue, and whether a personal guarantee is required all affect outcomes as well.
-
By full-approval rate, small banks perform best. The 2025 Federal Reserve SBCS found that 57% of small bank applicants received the full amount they sought, compared to lower rates at large banks, online lenders, and finance companies. However, online lenders typically have less stringent baseline requirements, which means more businesses are eligible to apply in the first place. The tradeoff is cost: 60% of online lender borrowers in the Federal Reserve survey reported that actual borrowing costs were higher than expected, compared to 32% at large banks and 37% at small banks.
-
Loan amounts vary because they are determined by the intersection of how much a business needs, how much a lender is willing to extend, and which program or product governs the transaction. SBA 7(a) loans average $477,642 but range from under $25,000 to $5 million. Online lenders may cap products at $150,000 to $500,000 depending on the provider. Loan size is also constrained by the business's revenue, debt service coverage, and collateral availability. A business generating $500,000 in annual revenue will qualify for a different range of amounts than one generating $2 million.
-
The Federal Reserve's Small Business Credit Survey is released annually, typically in March, covering the prior calendar year's data. The SBA Office of Advocacy updates its small business FAQ and state profiles annually, typically in February and mid-year respectively. SBA lending program data (7(a) and 504 activity reports) is updated monthly. Proprietary lender surveys, including Fora's Business Insights Report, are released annually. Journalists and researchers using this data should verify whether the statistics cited reflect the most recent survey cycle.
-
The most authoritative primary sources for U.S. small business lending data are: the Federal Reserve's Small Business Credit Survey (fedsmallbusiness.org), which provides borrower-side financing outcomes; the SBA Office of Advocacy (advocacy.sba.gov), which provides employment, GDP, and business count data; SBA lender reports (sba.gov), which provide loan volume and program-level data; the FDIC (fdic.gov), which provides bank-level lending and deposit data; and the CFPB (consumerfinance.gov/data-research/small-business-lending/), which is building a public small business lending database under Section 1071 of Dodd-Frank. For forward-looking sentiment and borrowing motivation data, proprietary surveys like Fora's Business Insights Report provide the owner's perspective that institutional datasets do not capture.
Since 2008, Fora Financial has distributed $5 billion to 55,000 businesses. Click here or call (877) 419-3568 for more information on how Fora Financial's working capital solutions can help your business thrive.


